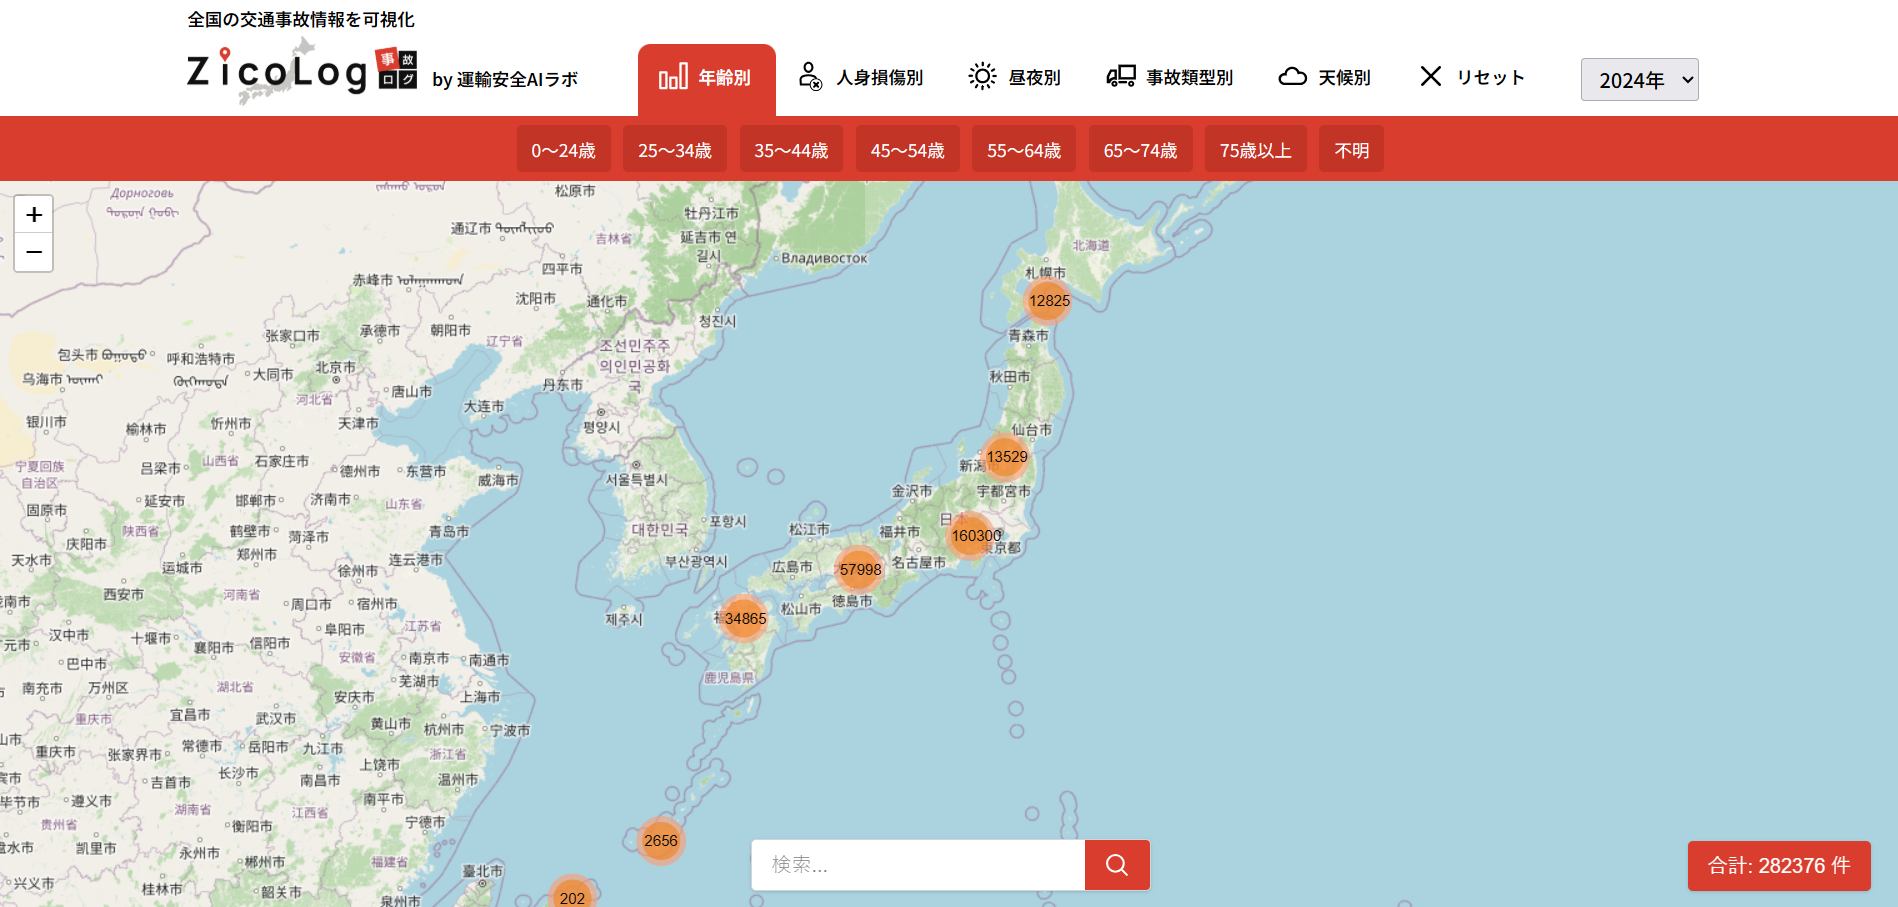
ZicoLog - Traffic Accident Visualization Platform
Overview
Developed a data visualization web platform for the Transportation Safety AI Laboratory that presents Japan's traffic accident records spanning 2019-2024. The system features an interactive map with location clustering, detailed incident data including weather, vehicle type, injury severity, and party-specific information. Supports advanced filtering across multiple dimensions and cross-tabulation analysis for safety research and policy decision-making.
Key Features
Interactive Map
Location-based clustering on Google Maps with street-level panoramic views of accident sites.
Advanced Filtering
Filter by age group, injury severity, time of day, accident type, and weather conditions.
Cross-tabulation Analysis
Examine correlations between variables across 2019-2024 accident data for safety research.
Detailed Incident Data
Comprehensive records covering party info, vehicle damage, collision points, and jurisdiction details.